
Work · 01
Why the housing market isn’t a bubble
A dashboard on why today’s high home prices aren’t 2008 all over again: what’s holding prices up, why it won’t pop the same way, the warning signs worth watching, and how it could still go wrong. US data with Milwaukee and Wisconsin alongside.
- Published
- October 2026
- Built with
- Claude (AI-directed), Python / pandas, D3
All my first-time homebuying friends are waiting for the bubble to burst (no judgment!). After inflation, US home prices are 15% above their 2006 peak, and Milwaukee is 13% above its own. If you were around for 2008, that number alone is enough to make you want to wait it out.
Since I spent 12 years in mortgage insurance, I’m often the bearer of bad news (for them): high prices alone don’t make a bubble. A crash needs forced sellers, lots of people who have to sell right now at any price. In 2008 there were millions. So I pulled the data straight from the agencies that publish it and checked whether they’re coming back.
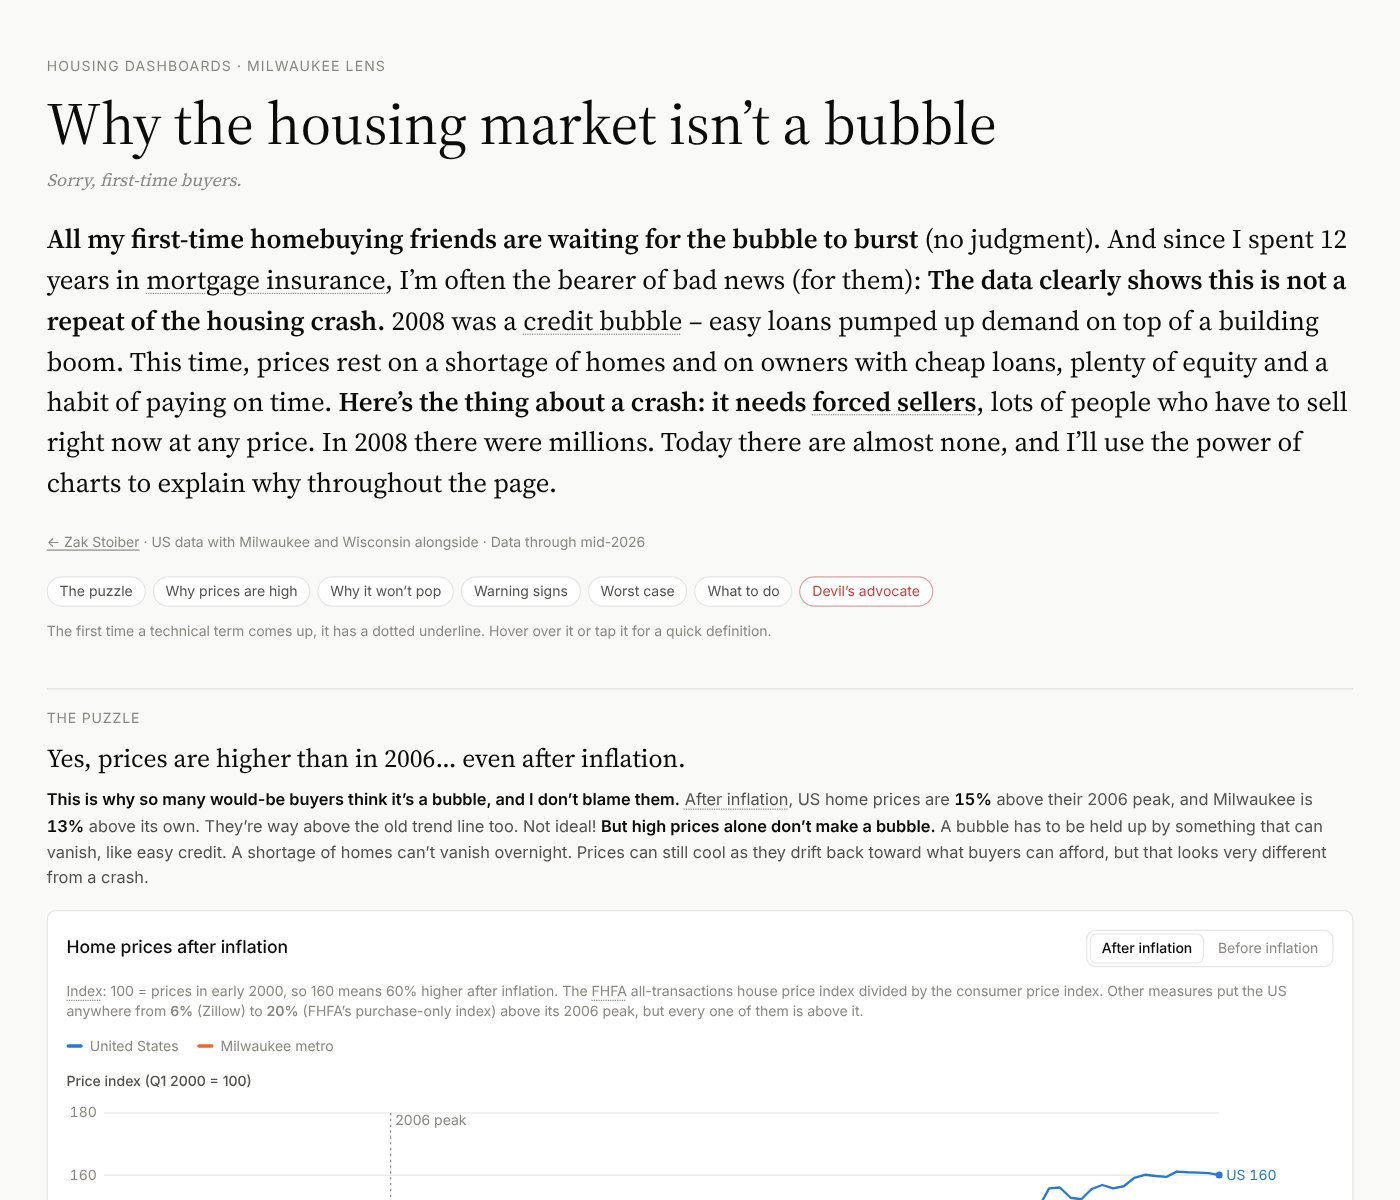
Open the interactive dashboard →
What I found
Prices are high because there aren’t enough homes
- The US stopped building. Before the bubble, the US approved about 1.67 million homes a year. Since 2008 it’s averaged 1.18 million, roughly 71% of that pace, while the number of households grew about 20%. Compared with the pre-bubble pace, that’s roughly 8.7 million homes that never got built, including about 55,000 in the Milwaukee metro.
- There’s no glut to dump. Just 1.2% of owner homes sit empty and for sale, against 2.9% in early 2008.
Why it won’t pop the same way
- Owners are locked in. About half of US mortgages (49%) carry a rate under 4%, and nearly one in five is under 3%. With a new loan above 7% this fall, people stay put, and the homes they’d have sold never hit the market. Wisconsin is even more locked in, at 53% under 4%.
- The loans are good. In 2006, 13.6% of new mortgage dollars went to borrowers with credit scores under 620. In 2025 it was 4.4%. Only 4.3% of mortgages have a rate that can adjust, so almost nobody’s payment is about to reset higher.
- Low down payments didn’t go away, but piggyback loans did. 57% of home-purchase loans still come with less than 20% down, the same share as 2006. The difference is how they’re made: in 2006, 28% of regular loans had less than 5% down, often through a second “piggyback” loan that skipped mortgage insurance. In 2025 it was 8%. With almost nothing down, even a small price dip leaves you owing more than the house is worth. And mortgage insurance covers the lender if you stop paying, so a second company checks that you can actually afford the loan. Piggyback loans skipped that check. (This one’s personal: in mortgage insurance, we even handed out flying pig stuffies as a promo item to talk people out of piggyback loans.)
- Owners have equity. After what they owe, homeowners own 72% of their homes’ value, up from 46% in early 2012. Just 0.3% of US mortgages are underwater.
- People are paying on time. At the worst of the crisis, 8.9% of US mortgage debt was three or more months behind. Now it’s 1.0%. New foreclosures went from about 566,000 a quarter at the 2009 peak to 55,000 this spring.
Put together, the conveyor belt that turned 2008’s dip into a crash (prices dip, owners go underwater, payments reset, banks foreclose, foreclosures push prices down again) has almost nothing to run on.
The honest part
The risk didn’t disappear. It moved, from shaky loans to stretched budgets.
- Buying is a squeeze. With 5% down, the payment on a typical US home takes 15.8% of average household income, close to the 17.8% of mid-2006. That’s about $2,175 a month in principal and interest, plus $145 for mortgage insurance. At October’s 7.3% rate it would be about 17%, nearly the 2006 level.
- Some warning lights are on. Builders have more unsold new homes than usual, a bigger share of credit card balances is going seriously late than before the pandemic, and 26% of people who used buy now, pay later paid late at least once last year.
- If it goes wrong, expect a slow leak. Even in 2008, with forced sellers everywhere, US prices took about 5.3 years to fall 19%. Since mid-2024, they’re up 6.9% before inflation but only 0.5% after it, which is how a stretched market usually cools.
The dashboard ends by arguing with itself: a deep recession, an AI bust, thin cushions for the newest buyers, rising insurance and property taxes, and places that built a lot. My own tripwires are unemployment heading toward 6%, the share of mortgage debt 90+ days late doubling, and builders’ unsold inventory going back above 10 months. If those three move together, the forced sellers are coming back.
How to use the dashboard
It reads top to bottom, like an article. The pills under the intro jump to each section. Terms with a dotted underline show a quick definition when you hover over or tap them, and the switches on some charts flip between views (before and after inflation, for example). The Methods section at the bottom links every source.
Method and data
- How I built it: I directed Claude to write the Python and D3 code, and I did the parts that take judgment: picking the questions and the sources, verifying the figures against the agencies’ own releases, and rewriting the page until my friends outside housing could follow it.
- Sources: FHFA’s House Price Index, National Mortgage Database and Monthly Interest Rate Survey; the Federal Reserve’s Financial Accounts; the New York Fed’s Household Debt and Credit Report; Census construction, sales, permits and vacancy data; BLS prices and unemployment; Freddie Mac’s mortgage rate survey; and Zillow. The devil’s advocate adds Ken French’s and Robert Shiller’s stock data, BEA, SEC filings, the Fed’s household survey, the CFPB and the Treasury’s Federal Insurance Office.
- Processing: Python and pandas, reading each agency’s own files (mostly multi-tab workbooks, zipped XML and fixed-width text) rather than a data portal, and checked against the agencies’ press releases.
- Visualization: a standalone D3 dashboard, built to be read by people who don’t work in housing.
- Download the data: quarterly series, credit and delinquency, mortgage stock, new loans by credit score, building permits, then vs. now, long-run prices, down payments, down payments by year, tech share of stocks, buy now, pay later.